Table of Contents
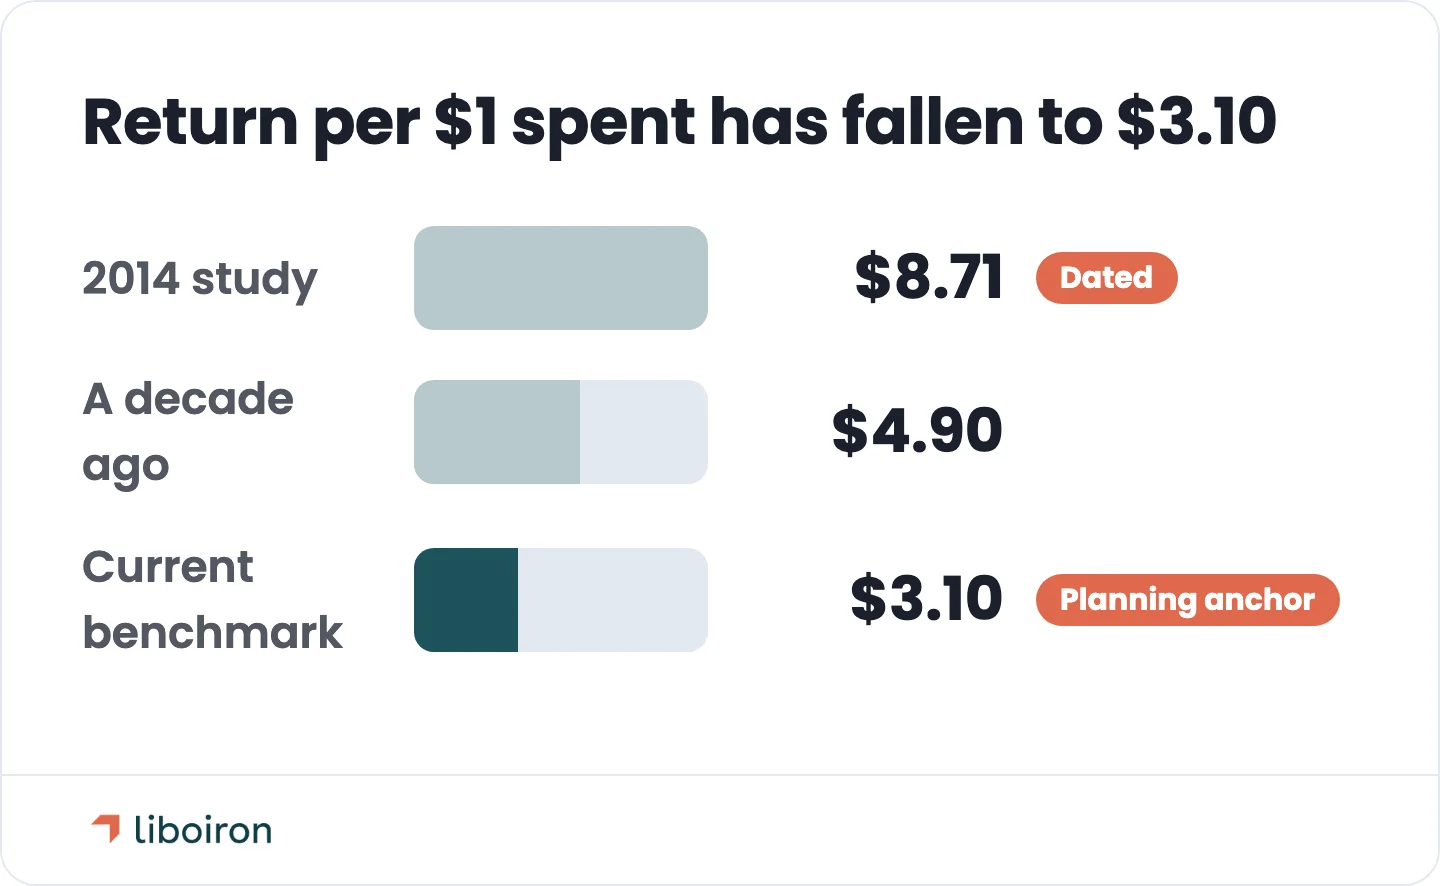
A well-run CRM returns about $3.10 for every $1 you spend on it, according to Nucleus Research. That is the honest current benchmark, and it is a lot lower than the "$8.71 per dollar" figure you still see quoted everywhere. The reason the number swings so much is simple: CRM ROI is not a property of the software. It comes from how the system gets implemented and whether your team actually uses it.
This guide covers the formula, the real costs most buyers miss, how to calculate your return on your own numbers, how long payback takes, and how to hit the return instead of joining the half of projects that fall short. We work on this every day at Liboiron. When we rebuilt the CRM for Lovepac, a Canadian packaging manufacturer, user adoption went from 0% to 80% and the sales cycle got 20% shorter. That gap between "we bought a CRM" and "we get the return" is what this article is about.
Key Takeaways
- Current CRM ROI averages about $3.10 for every $1 spent (Nucleus Research), down from $4.90 a decade earlier. The old "$8.71 per dollar" number is dated, so treat inflated benchmarks with caution.
- The formula is simple; the inputs are where people go wrong. ROI = (Gains − Total Cost) / Total Cost × 100. The work is capturing every cost and attributing the gains conservatively.
- Adoption is the single biggest ROI lever. Roughly half of CRM projects fall short of their objectives, and the cause is usually people and process, not the software.
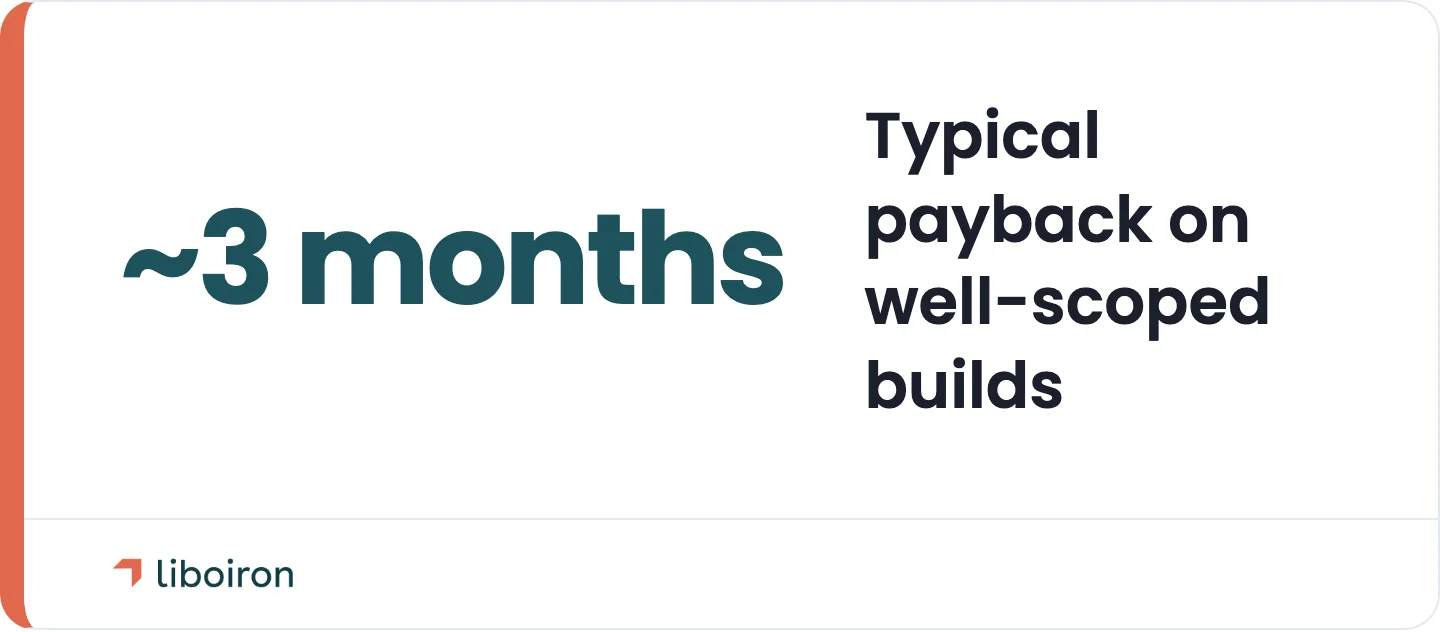
- Payback lands in months, not years when the rollout is scoped tight. We typically see ROI within about three months on well-scoped builds.
What Is CRM ROI?
CRM ROI is the financial return a CRM generates measured against everything it costs you. It answers one question: for every dollar you put into the system, how many dollars come back out as new revenue and recovered time?
The formula is straightforward:
CRM ROI = (Gains from CRM − Total Cost of CRM) / Total Cost of CRM × 100
The result is a percentage. Break-even is 0%, the point where the CRM has fully paid for itself. Anything above 0% is net positive. A negative ROI means the system is costing you more than it returns.
Two things make the math harder than it looks. First, most people undercount the cost, because the licence is only a fraction of the total. Second, gains are easy to overstate, because it is tempting to credit the CRM for revenue it did not cause. Get both of those right and the percentage becomes trustworthy.
What CRM ROI Should You Expect?
The current benchmark is about $3.10 returned for every $1 spent, per Nucleus Research. That figure has fallen roughly 37% over the prior decade, down from $4.90, as CRM software matured and the early easy wins got harder to find.
You will still see much bigger numbers. The "$8.71 per dollar" figure quoted all over the web comes from a 2014 Nucleus study, a different measure from a more competitive era. Nucleus's current benchmark is the $3.10 above, down from $4.90 a decade ago. Chasing the biggest headline number is a mistake, because those older figures describe a different market and averages hide a wide range.
Here is what the numbers actually say:
- The realistic average is around 3x, not 8x. Use $3.10 as your planning anchor, not the peak figures.
- The average masks a split. Estimates of how often CRM projects miss their objectives vary, up to the 55% in the Johnny Grow CRM Failure Report, and Forrester's research ties the cause to people and process, not the technology. Well-run rollouts sit far above the average; poor ones return nothing.
- Your number is yours. A benchmark is a starting expectation, not a promise. Your real return depends on your inputs, your industry, and your adoption.
The True Cost of a CRM
The subscription is the smallest part of what a CRM costs. To calculate ROI properly, you need the total cost of ownership, which is everything you spend to get the system live and keep it working.
- Licensing and subscriptions. The per-user monthly or annual fee. This is the cost most buyers focus on and the one that matters least.
- Setup, data migration, and integration. Cleaning up your existing data, moving it in, and connecting the CRM to your other tools. Linking a CRM to your accounting system, for example, is usually a built integration layer that syncs deals to invoices in QuickBooks, not a switch you flip on.
- Onboarding and training. The cost of getting your team fluent, plus the temporary dip in productivity while everyone learns the new system.
- Maintenance and admin. Ongoing support, workflow upkeep, and add-ons as your process changes.
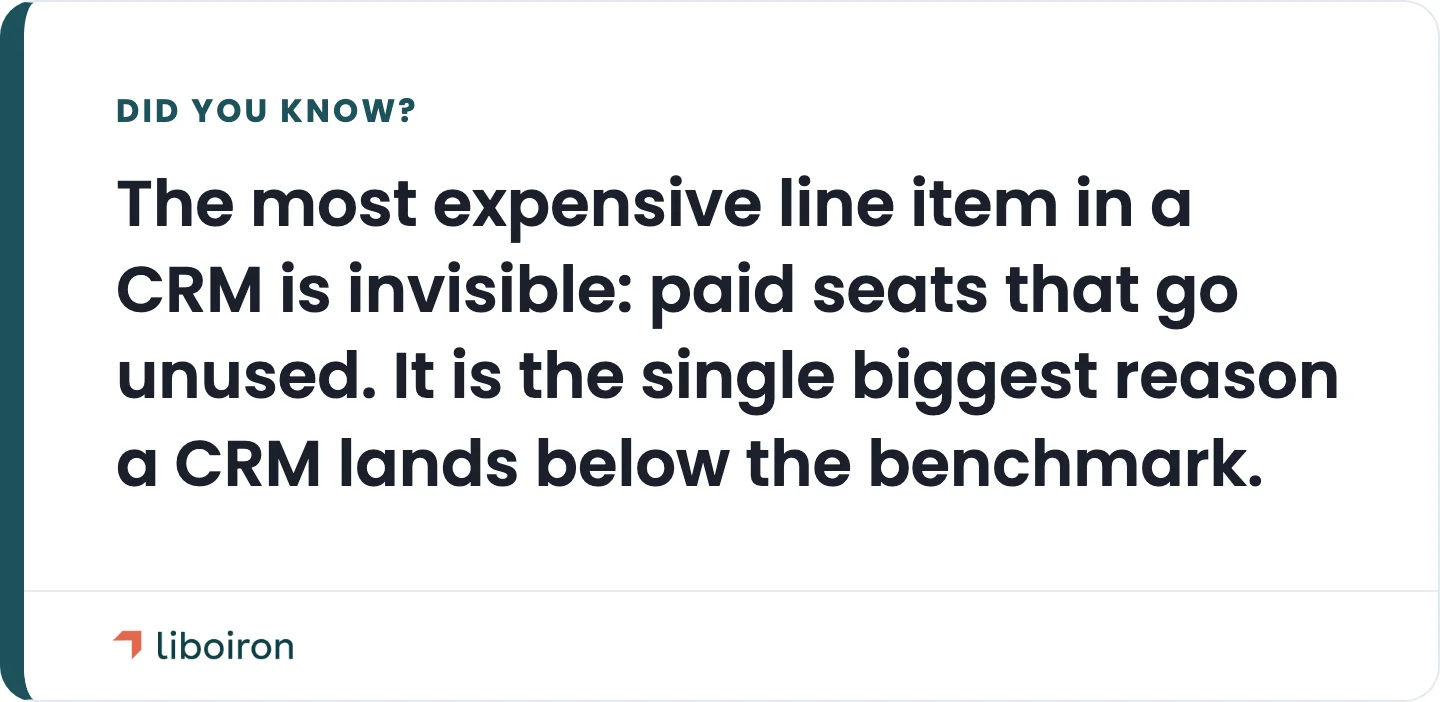
- The hidden cost of low adoption. The most expensive line item is invisible. When paid seats go unused, you pay full price for a system delivering partial value, and that gap comes straight out of your return. It is the single biggest reason a CRM lands below the benchmark.
Before you sign, ask the vendor what is included in the licence and what gets billed separately. The answer often changes the ROI math more than the sticker price does.
Where CRM Returns Actually Come From
CRM returns fall into two buckets: revenue you gain and time you recover. Both are real, and the strongest ROI cases count both.
Revenue gains:
- Higher close and conversion rates from following up faster and letting no lead slip.
- Larger average deal size through better cross-sell and upsell visibility.
- Better retention and customer lifetime value because nothing falls through the cracks after the sale.
- Shorter sales cycles from a cleaner pipeline and fewer manual handoffs.
Efficiency gains:
- Hours saved on manual admin through automation and centralized data, valued at your team's hourly cost.
- Faster lead response, which lifts conversion because reaching a new lead first is often what wins the deal.
- Cleaner forecasting and dashboard visibility, so leaders make decisions on live numbers instead of guesses.
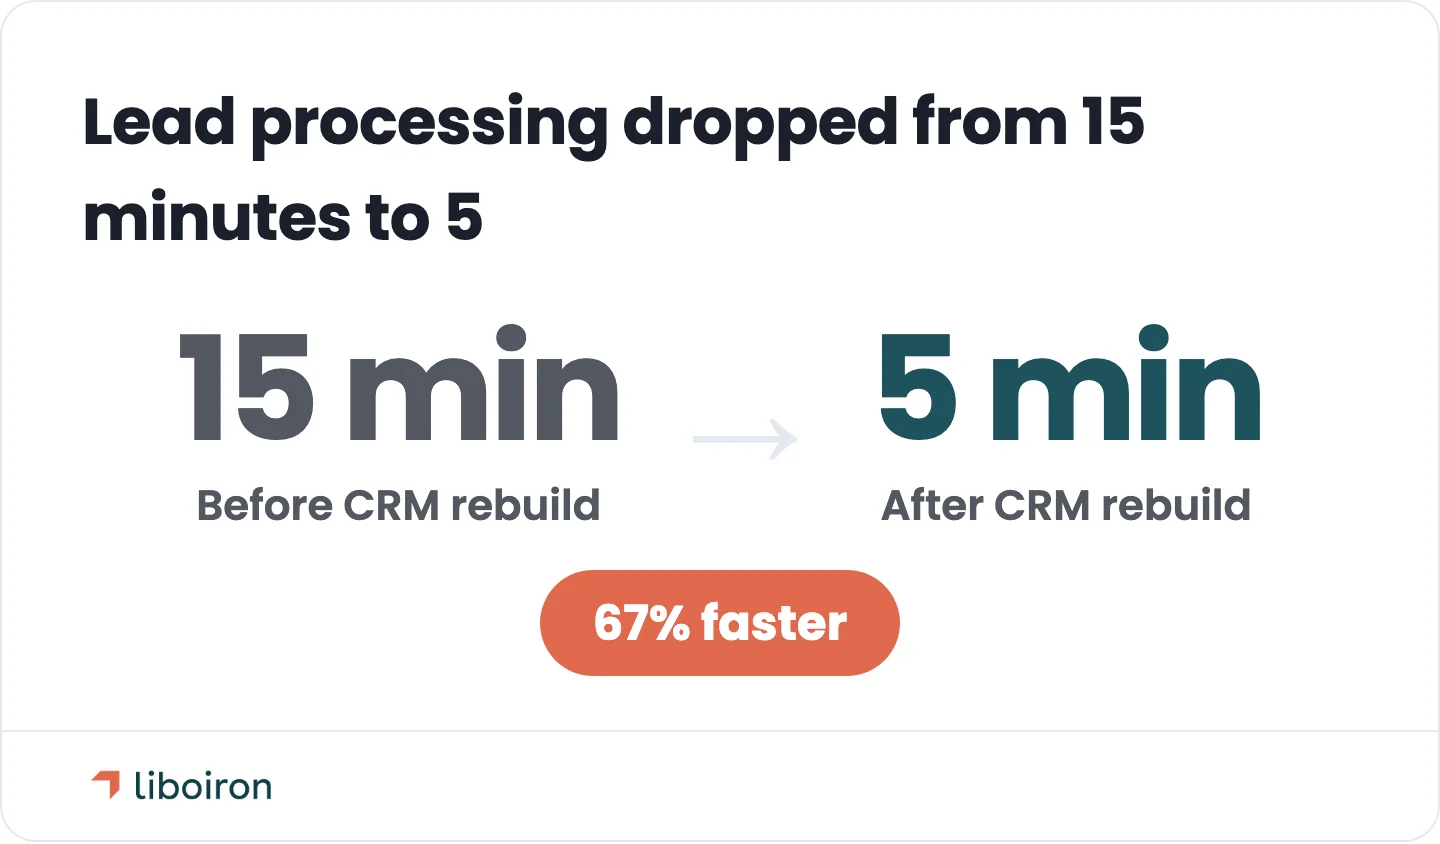
These are not abstract. When we rebuilt lead handling for Multilogements ChezTOIT, a Quebec property manager, lead processing dropped from 15 minutes to 5 (67% faster) and the team recovered more than 5 hours a week. For Lovepac, the manufacturer, the rebuild produced 15 dashboard reports where there had been none and cut the sales cycle by 20%. Each of those is a line in the "gains" side of the formula.
How to Calculate Your CRM ROI
Calculating CRM ROI takes five steps. The formula is easy; the value is in doing each input honestly.
- Set a timeframe and a baseline. Pick a period, usually 12 months, and record where you stand today: current close rate, average deal size, deals per month, and hours spent on manual admin. Without a baseline you have nothing to measure against.
- Total your incremental revenue gains. Estimate the added revenue you expect from higher conversion, larger deals, and better retention. Be conservative and only count what the CRM plausibly caused.
- Add your cost savings. Convert recovered hours into dollars at your team's loaded hourly rate, then add any tools the CRM replaces.
- Total your full investment. Add up every cost, not just the licence: setup, data migration, training, maintenance, and admin time.
- Apply the formula. Subtract total cost from total gains, divide by total cost, and multiply by 100.
Here is an illustrative example. Say a small sales team spends C$15,000 all-in for the first year (licences, setup, and training). A 10% lift in conversion plus a shorter sales cycle adds C$36,000 in new margin, and automating data entry saves 6 hours a week, worth about C$12,000 a year. That is C$48,000 in gains against C$15,000 in cost:
(C$48,000 − C$15,000) / C$15,000 × 100 = 220% ROI
Your real inputs will differ, so plug your own team size, deal value, and goals into our ROI calculator rather than borrowing this example's numbers.
How Long Until a CRM Pays for Itself?
Payback is the point where the value the CRM has generated overtakes what you have spent on it, the same as break-even at 0% ROI. For most businesses it lands in months, not years, when the build is scoped tight.
The math is front-loaded. Month one is negative because setup and training hit before the gains show up. Then value compounds as adoption climbs and automations take over the busywork, and at some point the cumulative return crosses the cumulative cost. That crossover is your payback point.
A focused implementation gets you there faster. Our Pipedrive builds typically run about 4 to 6 weeks for a simple setup and 6 to 8 weeks for a standard one, so the system is live and producing value early. On well-scoped projects, we usually see ROI within about three months.
The Metrics That Track Your CRM ROI
To measure CRM ROI instead of guessing at it, track a short list of numbers before and after go-live. Each one feeds the formula.
- Customer acquisition cost (CAC) and how many months of margin it takes to recover it.
- Customer lifetime value (CLTV), so you can weigh retention gains against acquisition cost.
- Conversion or win rate, the clearest signal that the pipeline is working.
- Sales cycle length, because faster deals free up capacity without new headcount.
- User-adoption rate. This one predicts all the others. If the team is not in the system, none of the metrics above will move.
- Hours saved per task, converted to dollars, for the efficiency side of the return.
- Net new revenue from upsell, cross-sell, and retention.
Set a baseline for each of these before you go live. The gap between the baseline and the same figure months later is your ROI, in numbers you can defend.
Why Adoption Decides Your CRM ROI
CRM ROI is a property of the implementation and adoption, not the software. The same platform can pay off handsomely for one company and return nothing for another, and the difference is almost never the tool.
The risk is real. Roughly 55% of CRM projects fail to meet their objectives, per the Johnny Grow CRM Failure Report, and the cause is usually people and process rather than the platform. When reps resist a CRM, it is usually because the system serves managers, not them. Their comp rewards closing deals, not updating fields, so data entry feels like unpaid overhead. That is a people and process problem, and it is where returns are won or lost. The full pitfall list and the playbook for driving daily usage are their own topic. For this article, the point is that adoption is the hinge the ROI turns on.
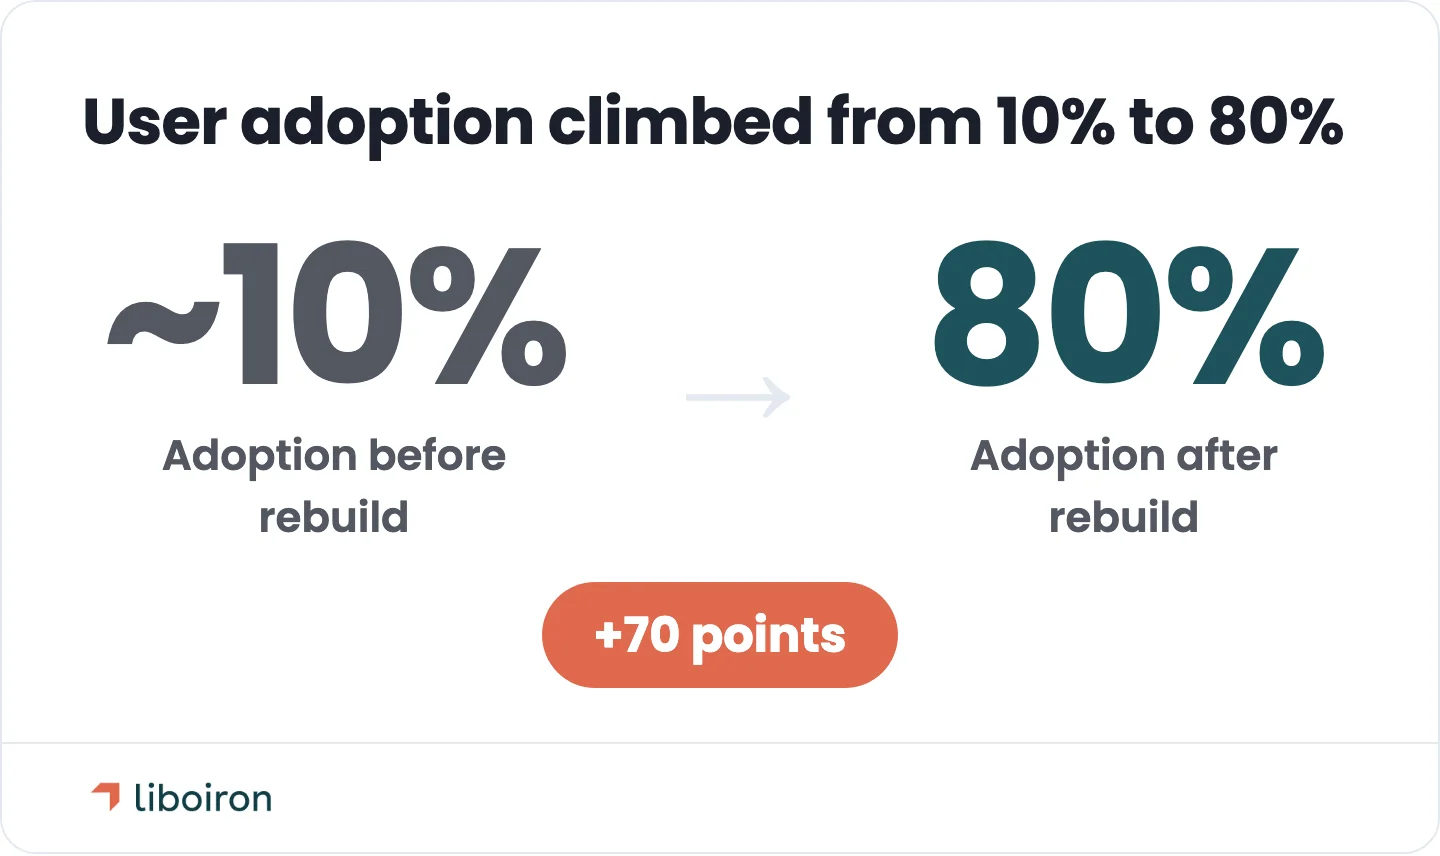
We saw it firsthand with Lovepac. Its HubSpot was running at about 10% of capacity and the VP of Sales had no visibility. After the rebuild, adoption reached 80%, the team got 15 dashboards from zero, and the sales cycle shortened by 20%. Nothing about the software changed. The implementation did.
Here is how to move your return in the right direction, adoption first:
- Make adoption the priority. Train the team, simplify data entry, and fit the CRM to how reps already work instead of forcing them onto a generic template.
- Automate the busywork. Follow-ups, data entry, and handoffs are prime targets. Our process automation work exists to take that load off the team so they sell instead of type.
- Build the dashboards. Visibility is why leaders keep using the system and why it earns budget every year.
- Keep the data clean. Garbage in kills every metric above, so enforce simple entry standards from day one.
- Align to your real process. Configure stages around how your deals actually close, not a vendor's default pipeline.
- Treat ROI as ongoing. Review the numbers each quarter and adjust. The return grows when you keep tuning it.
This is our whole thesis as a Montreal-based automation agency: the biggest ROI variable is who implements the system. We back that with results-guaranteed pricing and 18-plus years of automation experience, so the return is on us to deliver, not just to promise. If you want the framework we use, it is laid out on our methodology page.
Frequently Asked Questions
What is the ROI of a CRM?
CRM ROI is the return the system generates measured against its total cost. On average it runs about $3.10 for every $1 spent (Nucleus Research), which works out to roughly 210%, and any positive ROI means the CRM is returning more than it costs.
What is a good CRM ROI?
Anything above 0% means the CRM is paying for itself, and the $3.10-per-dollar average works out to about 210% ROI, so a well-run system landing there or higher is a realistic target. The honest answer is that a good CRM ROI is one measured against your own baseline, because a return that beats where you started is worth more than matching someone else's benchmark.
How do you calculate CRM ROI?
Use ROI = (Gains − Total Cost) / Total Cost × 100. Capture every cost, not just the licence, and attribute gains conservatively so the percentage holds up. Running your own numbers through an ROI calculator is the fastest way to get a defensible figure.
Why do CRM projects fail to deliver ROI?
They fail on adoption and process, not the software. Roughly half of CRM projects fall short of their objectives, and the cause is usually the people-and-process side rather than the tool, so the return depends on whether your team actually uses the system day to day.
How long does it take a CRM to pay for itself?
Months, not years, with a focused rollout and strong adoption. On well-scoped builds we usually see ROI inside about three months, because the system goes live fast and the gains start compounding early.
The Bottom Line
The $3.10 average is real, but it is conditional. The formula is easy, and the discipline behind it, counting every cost, attributing gains carefully, and driving real adoption, is the actual work. Get that right and payback lands in months, not years. Get it wrong and you join the half of projects that never see the return.
That is the gap we close. At Liboiron, we are a Pipedrive Service Partner that implements CRMs built for adoption, so the CRM ROI shows up in your numbers instead of your hopes, whether you run a manufacturing floor in Quebec or a growing team anywhere in Canada. If you want to see what the return could look like for your business, run your numbers through our ROI calculator or book a free strategic call and we will map it out with you.